Guides · Equalizers
What an audio equalizer is, and what the bars in a visualizer show
What an audio equalizer does, graphic vs parametric, the EQ in Spotify and on your phone, and what the bouncing bars in a music visualizer really show.
Updated November 1, 2026
In short
- An equalizer changes a sound: it turns chosen frequency ranges up or down. Bass and treble knobs, graphic sliders and parametric bands are all equalizers.
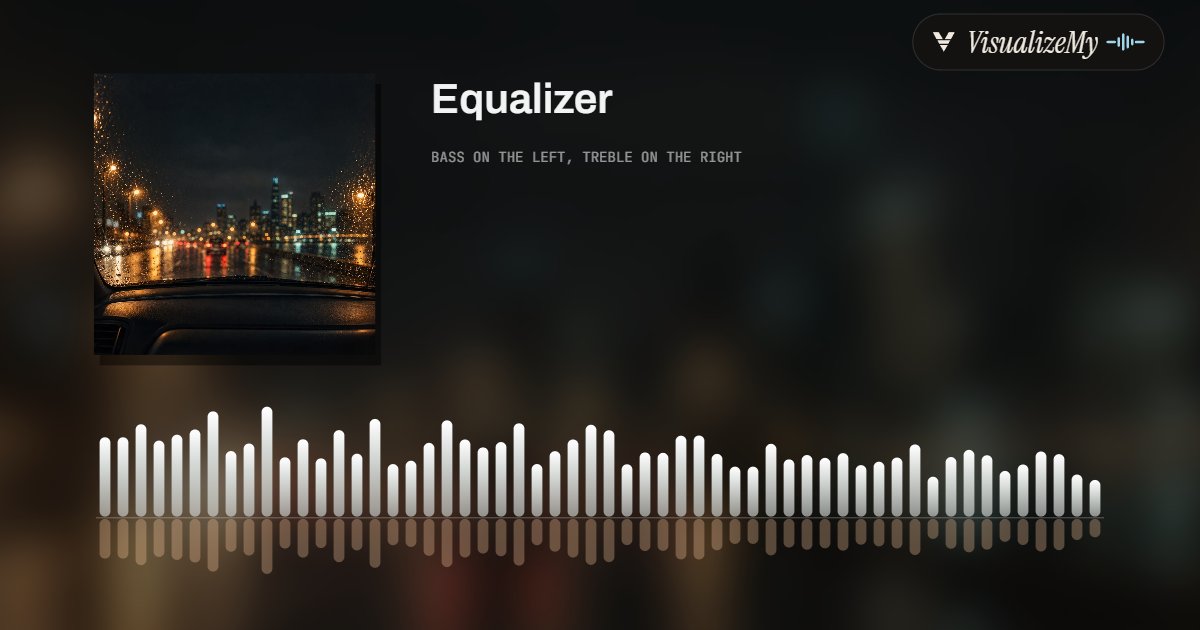
- The bars in a visualizer change nothing. They are a spectrum analyzer: the song's energy in each frequency band, bass on the left, measured many times a second.
- They look alike because both lay frequency out left to right on a scale where each octave gets the same width, and old hi-fi stereos put them side by side.
- Flat is the mix as it was made. Use EQ to fix your headphones or room, cut before you boost, and expect any boost to need headroom.
Two different things go by almost the same picture. One is the equalizer: the row of sliders on a stereo, the bass and treble knobs in a car, the EQ screen in Spotify. It changes the sound. The other is the row of bouncing bars in a music visualizer, which people search for as an “EQ visualizer”. It changes nothing; it shows what is in the sound. Both lay the frequencies of a song out from left to right, low to high, which is why they get mixed up. Hi-fi stereos of the 1980s and 1990s made it worse by putting a glowing spectrum display right next to the graphic EQ sliders.
This guide takes them one at a time: what an equalizer does and which kind you are looking at, how to use the one in your player without making things worse, and what the bars of a visualizer actually measure, using the numbers from our own visualizer engine.
What an equalizer does
Every sound is a mix of vibrations at different speeds, counted in hertz, cycles per second. People hear from roughly 20 Hz, a rumble you feel more than hear, to roughly 20,000 Hz, a hiss that fades from hearing with age. An equalizer splits that range into regions and lets you turn each one up or down, measured in decibels. Nothing is added or removed from the music; the balance between low, middle and high is shifted.
The name comes from the job it was first built for: making a signal equal again after something had bent it. Telephone lines lost their high frequencies over distance, and passive filters were added to put them back. In the 1920s John Volkman at RCA used adjustable equalization to tune the sound of cinemas, and from there it moved into every mixing desk and every home stereo.
A rough map of where things live helps more than any preset:
- 20 to 60 Hz, sub-bass: the weight of an 808, the rumble of a pipe organ. Small speakers and most phones barely play it.
- 60 to 250 Hz, bass: the kick drum’s thump and the bass guitar. Too much and everything sounds boomy.
- 250 to 500 Hz, low mids: the body of voices and guitars, and the region that turns muddy when a mix has too much of it.
- 500 Hz to 2 kHz, mids: most of a voice, the part that carries the melody.
- 2 to 5 kHz, presence: where the ear is most sensitive, so small boosts here sound loud and large ones sound harsh.
- 5 to 20 kHz, treble and air: consonants, cymbals, the shimmer on a vocal.
The kinds you will meet
Bass and treble knobs are the simplest equalizer. Each is a shelving filter: it raises or lowers everything below (or above) a turning point by the same amount, like lifting one end of a shelf. Our bass booster is exactly this, one low shelf you can place between 40 and 250 Hz and raise by up to 18 dB.
A graphic equalizer has a fixed row of bands, each with its own slider, so the slider positions draw the curve you are applying. The first true graphic equalizer is credited to Cinema Engineering in the 1950s. Home and car units usually have five to ten bands, one per octave; ten-band units sit near 31, 63, 125, 250 and 500 Hz and 1, 2, 4, 8 and 16 kHz, each double the last, because the ear hears pitch in ratios; our audio equalizer uses those ten bands. Professional live-sound units have thirty-one bands a third of an octave apart, on a standard series of center frequencies that runs 20, 25, 31.5, 40, 50, 63 and so on up to 20 kHz. The more bands, the narrower the problem you can fix without touching its neighbours.
A parametric equalizer has fewer bands, but for each one you choose the frequency, the amount, and the width, called Q. Narrow and deep, it can notch out one ringing note; wide and gentle, it can warm a whole voice. Daniel Flickinger built the first one in early 1971, and George Massenburg named it in a paper, “Parametric Equalization”, presented to the Audio Engineering Society in May 1972. Almost every EQ in recording software today is parametric, usually drawn as a curve with draggable points.
A high-pass filter, also called a low cut, removes everything below a frequency. It is the most used EQ move in mixing: rumble, handling noise and wind sit below where most instruments have anything to say.
The EQ in your player, and how to use it
Spotify has its own equalizer on iPhone, Android and desktop: profile picture, then Settings (and privacy on mobile), then Playback, then Equalizer. You can pick a preset or drag the points on the curve. Two things in Spotify’s own help page are worth knowing: you cannot change it while playing to another device through Spotify Connect, and on Android, when the phone has its own equalizer, Spotify uses that one, so your changes affect other apps too. On an iPhone or iPad, Apple Music’s equalizer is in Settings, then Apps, then Music, then EQ, where you choose one of Apple’s named settings rather than drawing your own curve.
A few rules keep an EQ from making things worse:
- Start flat. Flat is the song the way the engineer mixed it. Change something only when you can name what bothers you.
- Cut before you boost. If the vocals sound buried, try lowering the low mids instead of raising the presence. Cutting cannot overload anything.
- Every boost needs room. A 6 dB bass boost roughly doubles the amplitude down there, and a modern master already reaches full scale. Something has to give: the player turns everything down, a limiter squashes the peaks, or the signal clips and crackles. That is why our bass booster runs a limiter after the shelf, and also why it offers the clipped sound on purpose for people who want that distorted “bass boosted” effect.
- Small moves. Two or three decibels is a clear difference. Sliders pushed to the top are usually compensating for something else, often speakers that cannot play that range at all.
The popular “smile” curve, lows and highs up and mids down, has a real reason behind it. Fletcher and Munson measured in 1933 how loud different frequencies have to be to sound equally loud, and found that the ear is far less sensitive to bass and to extreme treble at low levels than in the middle, with the most sensitive region between 2 and 5 kHz. At quiet listening volumes a smile curve puts back what the ear is missing, which is what the old “loudness” button on stereos did. Turned up loud, the same curve just makes the music boomy and sharp.
What the bars in a visualizer show
The bars measure; they do not change. A visualizer, or the analyzer in an EQ plugin, takes a short slice of the audio, works out how much energy it has at each frequency, and draws that as a row of bars. Then it takes the next slice and does it again, many times a second. That is a spectrum analyzer, and a display of one is what a “spectrum visualizer” or “EQ visualizer” is.
Here is how ours does it, as a concrete example. For each frame of video, thirty a second, it takes 2,048 samples of the song centred on that moment, about 46 milliseconds at CD quality, softens the edges of that slice so the cut does not register as noise, and runs a Fourier transform, which turns the slice into 1,024 frequency readings spaced about 21.5 Hz apart. Those readings are evenly spaced, but hearing is not: an octave from 40 to 80 Hz matters as much as one from 4,000 to 8,000 Hz. So the readings are grouped into 64 bands on a logarithmic scale from 40 Hz to 16 kHz, each about a seventh of an octave wide. The low bands hold one or two readings each and the top bands hold dozens.
Three more adjustments turn that into something worth watching:
- Tilt. Music has much more energy in the bass than the treble, falling steadily with frequency. Drawn raw, the right half of the display would barely move. The bands are weighted upward with frequency, up to twice as much at the top, so a hi-hat is visible.
- Compression. Heights are scaled against the loudest moment of the whole song and then compressed, so quiet passages still show shape and loud ones do not flatten against the ceiling.
- Fast up, slow down. A bar jumps to a new peak instantly but falls back gradually, losing about a fifth of its height each frame. That is how hardware meters behaved, and it is what lets the eye follow a kick drum instead of seeing a flicker.
Every visualizer makes these choices differently, which is why two of them can look different on the same song.
Reading the bars
Once you know the layout, a spectrum is easy to read. The kick drum is a jump on the far left that falls away in a fraction of a second. The bass line is a steadier mass beside it that changes with the notes. Voices and guitars fill the middle, and hi-hats and cymbals make the right side sparkle. A DJ’s filter sweep shows up literally: only the left bars move, and the right side opens up bar by bar as the filter rises. A dark, warm mix leans left; a bright one keeps the right half busy.
What the bars cannot show is the music itself. They show energy, not notes. A sung melody and a held organ chord in the same register look about the same, and two very different songs in the same genre produce very similar pictures. That is the honest limit of a spectrum visualizer, and the reason ours also listens for the kick, the loudness of each section and the drop, so that a chorus looks like a chorus and not just a busier row of bars. A related test separates real visualizers from fake ones: scrub to a silence or a hard stop in the song. Bars that are calculated from the audio go quiet with it. Many template tools animate soundwave stickers on a timer, and those keep bouncing.
Making one
If what you wanted was the bars themselves, as a video for YouTube, TikTok or Reels, the audio visualizer does that from your song: Bars puts a mirrored spectrum under the cover and title, Halo bends the same 64 bands into a ring around a round cover. Both are calculated from your file in your browser and exported as a 1080p MP4. To watch them live while music plays instead, the live visualizer listens to a browser tab or the microphone and draws the same styles full screen.
And if what you wanted was to change the sound, the equalizer in your player is enough for listening. For a file you will post or play somewhere else, change it once and save it: an audio equalizer for any band, a bass booster for the low end, a volume booster for the whole thing.
Questions
What is an audio equalizer?+
A control that turns some frequencies of a sound up or down and leaves the rest alone: more bass, less harshness, a clearer voice. The bass and treble knobs on a stereo are the simplest one. A graphic equalizer has a row of sliders, each for a fixed band; a parametric one lets you choose the frequency, the amount and the width of each change.
What do the bars in a music visualizer mean?+
Each bar is one slice of the frequency range, bass on the left and treble on the right, and its height is how much energy the song has in that slice at that moment. The kick drum lifts the bars on the far left, a voice sits in the middle, hi-hats flicker on the right. It is a spectrum analyzer: it measures the sound and changes nothing.
Is a visualizer the same thing as an equalizer?+
No, though they look alike. An equalizer is a setting that changes the sound and stays where you put it. The bars of a visualizer are a measurement that moves thirty or sixty times a second and cannot change anything. Hi-fi stereos used to put a spectrum display right next to the graphic EQ sliders, which is where the name EQ visualizer comes from.
What is the best equalizer setting?+
There is no single one. Flat plays the song the way it was mixed; a change only helps when it fixes something about your headphones, your speakers or your room. A gentle lift of the lows and highs, the smile curve, often sounds better at low volume because the ear hears bass and extreme treble less when it is quiet. Cut what bothers you before boosting what you miss.
What do Hz and dB mean on an equalizer?+
Hz is the frequency, how many times a second the sound vibrates: 60 Hz is deep bass, 1,000 Hz is the middle of a voice, 10,000 Hz is the sizzle of a cymbal. dB is how much that band is turned up or down. Six dB up is about twice the amplitude and sounds clearly louder; one or two dB is a subtle change.
Why do equalizer sliders sit at 31, 63, 125, 250 Hz and so on?+
Because the ear hears pitch in ratios, not steps: every octave doubles the frequency. A ten band graphic EQ puts one slider per octave, each about double the last, from around 31 Hz to 16 kHz. Professional live-sound units use thirty-one sliders a third of an octave apart, on a standard series of center frequencies that starts 20, 25, 31.5, 40, 50, 63.
Can I make an EQ visualizer video of my song?+
Yes. Drop the song in the audio visualizer, pick Bars or Halo, and export a 1080p MP4. The bars are calculated from your file, 64 bands for every frame of video, so they move with your song and not with a loop that only happens to be in time.
Sources, read November 1, 2026
Related
- Audio visualizerSpectrum bars or a halo, as a 1080p video of your song.
- Live visualizerThe same bars full screen, listening to whatever is playing.
- Audio equalizerTen bands, 31 Hz to 16 kHz, on your own file, MP3 or WAV out.
- Bass boosterOne low shelf, up to 18 dB, with a limiter so it does not crack.
- Volume boosterLouder overall, or matched to a loudness target.
- What a music visualizer isHow a song becomes frames, beyond the spectrum.
- What a sound waveform isLevel over time, the other picture of the same numbers.