Guides · Waveforms
What a sound waveform is, and how to read one
What a sound waveform shows, how a recording becomes that shape, how to read loud, quiet, clipping and silence in it, and how to make your own.
October 13, 2026
In short
- A waveform is air pressure over time, drawn left to right. Height is how far the pressure moved; the line crosses the middle thousands of times a second.
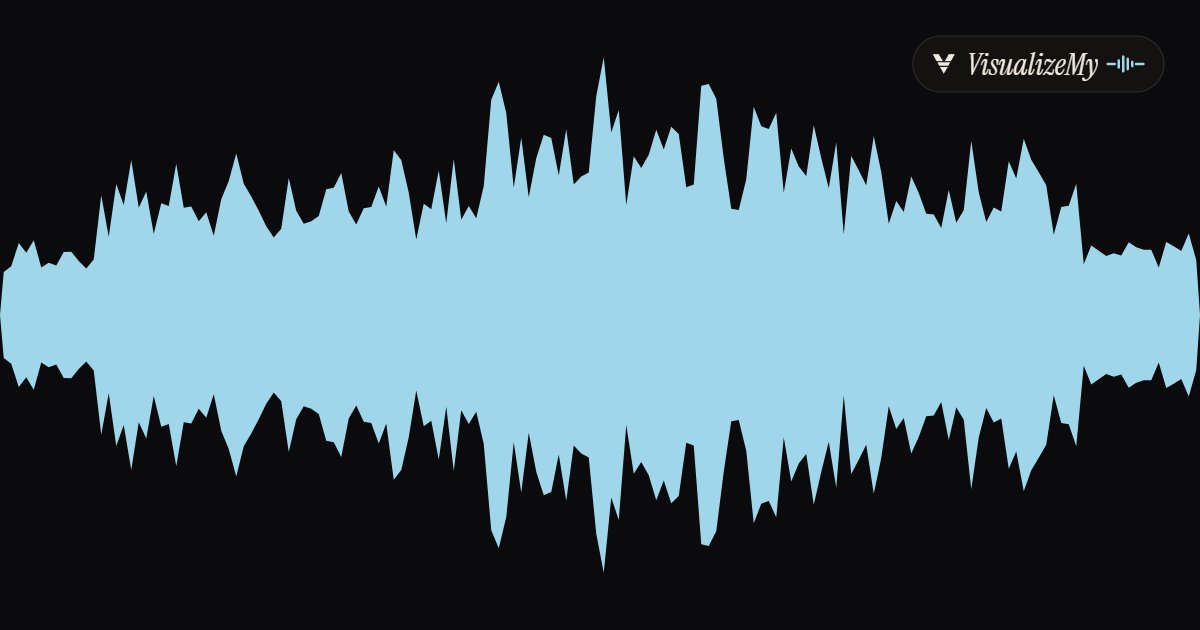
- Zoomed out, an editor draws the loudest value of each slice, so a whole song looks like a filled shape: tall in the chorus, flat in the pauses.
- Flat tops mean clipping. A shape that fills the whole height from start to end means the dynamics were squeezed, not that the recording is good.
- A waveform shows when a sound is loud; a spectrum shows which pitches are in it. Both are drawn from the same numbers.
Every audio editor, every podcast app and every music player with a scrub bar shows the same picture: a jagged shape that runs left to right, fat where the music is loud and thin where it is quiet. That picture is the sound waveform. It is not a decoration and not a visualizer effect; it is the recording itself, plotted. Once you can read it you can find a breath in an interview, spot a ruined take before you listen to it, and tell a crushed master from a dynamic one at a glance.
What the shape is
Sound is air pressure rising and falling very quickly. A microphone turns that pressure into a voltage that rises and falls the same way, and a recorder measures that voltage tens of thousands of times a second and writes down each measurement as a number. CD quality is 44,100 measurements a second; most video and streaming audio is 48,000. Each number says how far the pressure was from rest at that instant, positive for a push and negative for a pull, within a fixed range the recorder cannot exceed.
A waveform is those numbers drawn in order. Time runs along the bottom, level runs up and down, the middle line is silence, and the line swings above and below it on every cycle of every vibration. A low note swings slowly, a few hundred times a second; a cymbal swings thousands of times a second on top of it. At full zoom you see the individual cycles. Zoomed out to a whole song, the cycles are far too dense to draw, and what you see instead is the outline of all that swinging: the envelope.
Why a whole song looks like a filled shape
A three minute stereo song at CD quality is about eight million numbers per channel. A screen is a couple of thousand pixels wide. An editor divides the song into as many slices as it has pixels, finds the loudest value in each slice, and draws a bar of that height, mirrored above and below the middle. That is the shape you see in every player: not the sound wave itself but its peaks, slice by slice.
Many editors also draw a second, darker shape inside the first: the average level of each slice rather than its peak, usually the RMS, the root mean square. The outer shape is how far the peaks reach; the inner shape is closer to how loud the slice feels. A snare hit has a tall peak and a small average; a sustained organ chord has a modest peak and a large average. When two songs look the same height but one sounds much louder, the inner shape is where the difference lives.
How to read one
A few shapes come up in every recording:
- Silence is a flat line on the middle. Real silence in a room is a very thin fuzz, never perfectly flat; a perfectly flat stretch usually means digital silence that was inserted or a dropout.
- A fade is the envelope tapering to the middle over a few seconds.
- Speech is bursts with gaps: each word or phrase is a cluster, each pause a gap. Podcast editors cut on the gaps without listening, which is the main reason the waveform exists in an editor at all.
- A song’s structure is visible: the verses sit lower, the chorus is taller, a breakdown dips, the final chorus is the tallest block. On a dance track the drop is a cliff.
- Clipping is flat tops. A recorder cannot store a value above its maximum, so a signal that was too loud going in has its peaks shaved off, and the waveform shows hard horizontal edges at the top and bottom. It sounds like crackle on the loud notes and cannot be repaired afterwards, only hidden.
- A limited master fills the whole height from the first bar to the last with almost no valleys. Most commercial releases since the late 1990s look like this, the result of the loudness race between labels. Streaming services now turn such files down to a standard loudness on playback, which removed most of the reason for it, but the habit stayed.
- Lopsidedness, more above the line than below or the reverse, is DC offset or an asymmetric source such as a brass instrument; it is harmless in itself but wastes headroom.
- Two lanes are the two channels of a stereo file. If the lanes look identical the mix is close to mono; wide stereo shows up as lanes that differ.
What a waveform does not show
A waveform shows when a sound is loud and how loud, and that is all. It does not show pitch, which instrument is playing, or whether the sound is bright or dull. Two sounds with the same loudness curve, a bass note and a hi-hat, draw the same envelope. For that the same numbers are turned into a different picture: the spectrum, which splits one instant into frequencies and draws a bar for each, bass on the left and treble on the right. Music visualizers that show bars jumping with the song are drawing the spectrum thirty or sixty times a second, from the same file the waveform comes from. A spectrogram puts the two together, time along the bottom and frequency up the side, with brightness for level, and is what people use to see a melody or find a hum.
An oscilloscope offers a third view. Plot the left channel sideways and the right channel up and down instead of both against time, and a mono passage becomes a diagonal line while a wide stereo chord blooms into a ring. It is the same waveform, drawn against itself.
Where waveforms are used
The waveform under a player’s scrub bar tells the listener where the loud parts are before they get there. Podcast and audiobook editors live in it, cutting breaths, pauses and mistakes by shape. Mastering engineers compare a mix against a reference by putting the two waveforms side by side. Sound designers find a click or a dropout by its spike or its flat gap.
Outside the studio the waveform has become an image in its own right. A podcast cover or a clip for Reels often carries the show’s waveform as a graphic; a Spotify Canvas or a YouTube video for a track sometimes uses the song’s own shape. Sound wave art prints the waveform of wedding vows, a child’s first words, a voice message or a heartbeat on a poster, a ring or a piece of wood. Those are made from the real file, which is why they look like a real recording: a few slices of silence, a word, a pause, a longer phrase.
How to make one
Drop the audio file in the waveform image generator. It reads the peaks of the whole file in your browser, without uploading anything, and draws them as bars, a filled shape or a single line, in a color you choose, on a dark, white or transparent background. Download a PNG at one of four sizes, or an SVG, which is a vector drawing: open it in Figma, Illustrator, Inkscape or a cutting machine’s software and scale it to any size without the edges softening. Detail sets how many slices the file is cut into, from 64 bold bars to 512 fine ones.
If the waveform should move, the waveform video maker draws it from the same file as a 1080p MP4, the line writing itself across the frame as the voice plays, for a podcast clip or a voice note on Reels and Shorts.
Questions
What does a sound waveform show?+
How the air pressure at the microphone changed over time, drawn left to right. The height at any point is how far the pressure was pushed from rest at that instant; the line crosses the middle thousands of times a second. Zoomed out to a whole song, what you see is the envelope of that line: tall where the music is loud, flat where it is quiet.
Why do audio editors show a waveform and not the actual sound?+
Because a waveform is the actual sound, as a picture. A CD-quality recording holds 44,100 numbers per second per channel; the waveform is those numbers plotted in order. An editor cannot draw eight million points across a screen that is two thousand pixels wide, so it draws the loudest value in each slice instead, which is why a whole song looks like a solid shape rather than a line.
What does clipping look like on a waveform?+
Flat tops. A digital recording cannot hold a value above full scale, so a signal that was too loud when it was recorded has its peaks sliced off, and the waveform shows a hard horizontal edge at the top and bottom instead of a rounded peak. It sounds like a crackle or a buzz on the loud notes and cannot be undone afterwards.
Is a louder waveform a better recording?+
No. A waveform that fills the whole height from start to finish usually means the dynamics were squeezed flat with a limiter, which is common in commercial masters and tiring to listen to. A recording with visible peaks and valleys has room between loud and quiet, which is what dynamics means. The height of the shape says how the file was leveled, not how good it sounds.
What is the difference between a waveform and a spectrum?+
A waveform plots level against time: when the sound is loud. A spectrum plots level against frequency: which pitches are in it, bass on one side and treble on the other, for one moment. A spectrogram shows both, frequency up the side and time along the bottom. Visualizers that show bars jumping with the music are drawing the spectrum, thirty times a second.
How do I turn a sound wave into an image or a print?+
Drop the file in a waveform image generator, pick bars, a filled shape or a line, and download a PNG or an SVG. The SVG is a vector, so it scales to a poster or a ring without losing its edges and opens in Figma, Illustrator or a cutting machine's software. Sound wave art of vows, a voice message or a heartbeat is made this way.