Guides · Music visualizers
What is a music visualizer, and how one is made
What a music visualizer is, live player effect or rendered video, how software turns a song into frames, what it reacts to, and what makes one good.
October 19, 2026
In short
- A music visualizer is a picture driven by the sound itself: bars, a waveform, a ring, a scene that reacts to the kick and the loudness.
- The word means two things: the live effect a player shows while a song plays, and a video file rendered from a song for YouTube, TikTok or Reels.
- Software cuts the audio into slices, splits each into frequencies, and finds events such as onsets, the kick, section loudness and the drop; a template draws one frame from them.
- A good one reacts to a few clear events and stays readable; one that reacts to everything just shakes.
A music visualizer is a picture that moves with a song because the software is measuring the song. Bars rise when the bass comes in, a ring around the cover jumps on the kick drum, the whole frame changes color when the chorus drops. Nobody animated those moments by hand; the audio drove them.
The word has two meanings, and which one a person means depends on when they learned it. For anyone who used Winamp or iTunes, a visualizer is the effect a music player shows full screen while a song plays: live, endless, gone when the song stops. For anyone releasing music now, a visualizer is a video file: the song, the cover art and motion that follows the track, uploaded to YouTube, TikTok or Reels, where a bare audio file cannot be posted. Labels put out “official visualizers” next to music videos, and independent artists make them because a filmed video is out of reach. Both meanings share the same machinery, and the second is mostly the first, written to a file.
From a box under the TV to a file on YouTube
The idea is older than home computers. Atari sold the Video Music in 1977, a box designed by Robert Brown, who had built the home version of Pong: it sat between a stereo and a television and turned the music into colored shapes on the screen. It sold poorly and was gone within about a year, but it fixed the pattern every visualizer since has followed: take the signal, measure it, draw something from the measurements.
The form peaked with the MP3 player. Winamp shipped with a spectrum and an oscilloscope in its corner, and plug-ins went much further. MilkDrop, written by Ryan Geiss and first released in 2001, used the graphics card to warp and feed back the previous frame, so the picture flowed rather than flickered; its preset format became a small art scene of its own and still runs today in the open-source projectM. Apple’s iTunes 8 in 2008 replaced its visualizer with one built from Robert Hodgin’s Magnetosphere, glowing particles drawn by the music, which The Barbarian Group adapted for Apple.
Then listening moved to streaming apps, which mostly dropped the full-screen effect, and the visualizer moved to the place people now hear new music: video platforms. The live effect became a rendered file.
How a visualizer turns a song into frames
Every music visualizer, live or rendered, runs the same four steps. Here is how ours does it; the numbers vary between tools but the shape does not.
1. Decode and slice. The song is decoded to raw samples, tens of thousands of numbers per second per channel (44,100 at CD quality). A video runs at 30 frames a second, so each frame owns about 1,470 samples of the song. For each frame we take a window of 2,048 samples centered on its moment.
2. Split into frequencies. A Fourier transform turns that window from a list of pressure values into a list of frequencies: how much energy sits at 50 Hz, at 200 Hz, at 5 kHz. Those raw frequencies are spaced evenly, which is useless for music: half of them would sit above 11 kHz, where there is mostly cymbal hiss. So they are grouped into bands spaced the way hearing is, by octave. We use 64 bands from 40 Hz to 16 kHz, each a fixed ratio wider than the last. The bass gets as many bars as the treble even though it covers far fewer hertz, and each band is smoothed so a bar falls back gently instead of snapping to zero. That row of 64 numbers is the spectrum, and it is what every bar visualizer draws.
3. Find the events. A spectrum alone makes a picture that jitters with everything. What makes a visualizer feel like it is listening is a few musical events pulled out of the numbers:
- Onsets, moments where energy jumps across the spectrum compared with the frame before. That is every hit: a drum, a plucked note, a consonant.
- The kick, the same measurement on the low bands only. It is the steadiest pulse in most popular music and the best thing to lock motion to.
- Section loudness, the average level over about three seconds. It rises in the chorus and falls in the verse, so it can drive slow changes such as zoom, glow or color without twitching.
- The drop, how much louder this moment is than the four seconds before it. A drop that comes from silence or a breakdown scores high; a song that is loud throughout scores nothing, which is correct.
- Tempo, from the spacing of the onsets. It lets a template change something every bar instead of at random.
4. Draw and encode. A template is a function that takes one frame’s numbers and draws a picture: the 64 bands, the event values, the stereo waveform, the cover, the title. Run it for every frame, hand the frames and the audio to a video encoder, and the result is an MP4. Our visualizer does all of this in the browser with WebCodecs, so the song never leaves the device.
A live visualizer does the same thing with less time. In a browser, the Web Audio API’s AnalyserNode hands a page the current spectrum while audio plays, and the page draws it before the next screen refresh. That is how Winamp-style effects work: they see only what has played so far and have a few milliseconds per frame. A rendered visualizer can analyze the whole file first, so it knows the loudest moment of the song before frame one, normalizes against it, and gives the same result every time it runs. A frame can also take longer than real time if the effect needs it.
What the picture can follow
Those measurements map onto a handful of picture types, and nearly every visualizer is one of them or a mix:
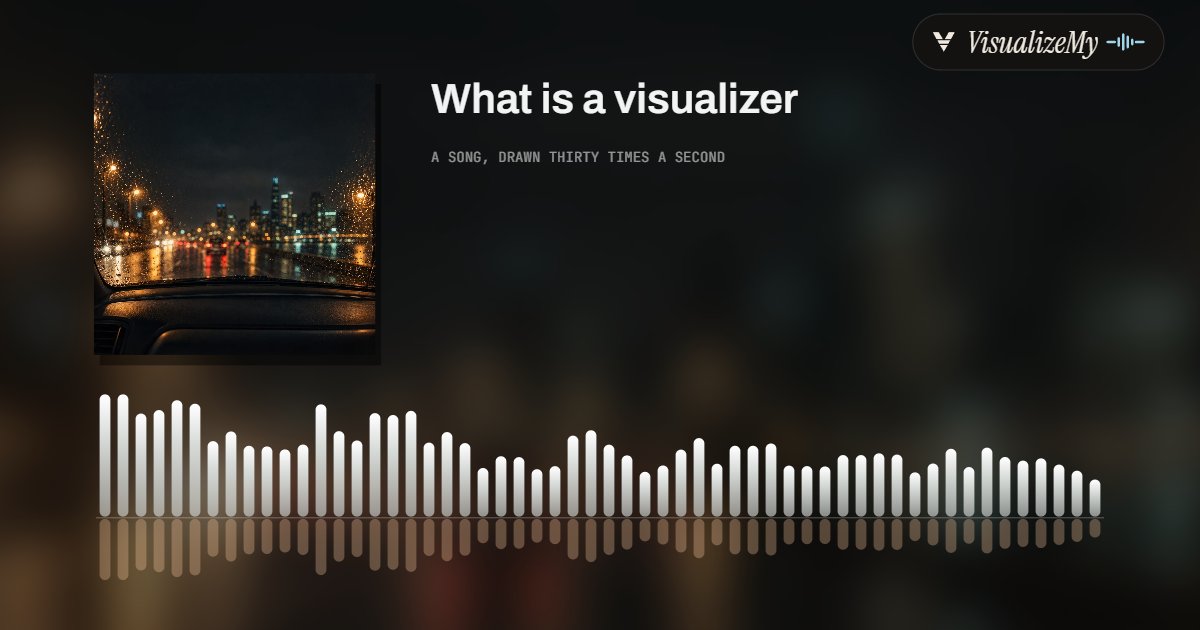
- Spectrum bars: one bar per band, bass on one side, treble on the other, often mirrored. The classic, and the one people mean by “audio visualizer”. Our audio visualizer page is this.
- Waveform: the samples themselves drawn as a line, which wobbles with the sound. Clear for speech, busy for dense music.
- Oscilloscope: the left channel on one axis and the right on the other. A mono passage collapses to a diagonal line, wide stereo blooms into loops, and music written for it draws pictures; see the oscilloscope visualizer.
- Radial: the spectrum bent into a ring, usually around the cover art.
- Scenes: a designed picture where the events drive objects rather than bars. A record that turns and flashes on the kick, a film frame that jumps with the drums, ink that blooms on every hit, a cartoon that dances on the beat. The audio is still the driver; it just moves things a viewer cares about.
What makes a good one
Having built nineteen of them, our view is that a visualizer works when it reacts to a few clear events and ignores the rest. Tie every element to every frame of the spectrum and the picture shakes constantly, so nothing reads as a hit. Tie one strong motion to the kick, one slow change to section loudness and one big change to the drop, and the viewer feels the song’s structure: the verse is calm, the chorus opens up, the drop lands.
A few other things separate the ones people finish watching from the ones they skip:
- It is legible as a still. The first frame is also the thumbnail and the frame a scroller decides on. A title that is readable at phone size and a cover that is not buried under effects matter more than the effect.
- It is laid out for the screen it plays on. A 16:9 layout cropped to 9:16 loses half of itself. Vertical needs its own composition: bigger type, the subject in the upper middle, room for the app’s own buttons at the bottom.
- It reacts to this song. Two songs should look different through the same template: a ballad should barely move it, a club track should throw it around. If a template looks the same under everything, it is a loop with extra steps.
- It stays out of the way of the music. A visualizer is packaging. For a song people already want to hear, a still cover on YouTube is a perfectly good upload, and some artists prefer it. Motion earns its place where the video has to stop a scroll: Shorts, TikTok, Reels, and the first seconds of a YouTube upload.
The honest counterpoint: a visualizer does not build an audience the way a performance or a story does. It makes a track postable and gives it a recognizable look across a release. For anything beyond that, the song does the work.
How to make one
Drop an audio file into the music visualizer, or search for a song to use its 30 second preview. Pick one of nineteen styles; each one reacts to the kick, the section loudness and the drop in its own way, and the preview plays the real analysis of your track. Choose 16:9 for YouTube, 9:16 for TikTok, Reels and Shorts, or square, pick a length, and export a 1080p MP4 with the audio. It renders on your device, with no signup and no watermark.
If all you need is the song and its cover on YouTube with no motion, MP3 to MP4 does that over the whole track. To see how the tools that make visualizers compare on watermark, length and resolution, read the best music visualizers.
Questions
What is a visualizer in music?+
A picture that moves with a piece of music, driven by the sound itself: bars that rise with the bass, a line that traces the waveform, a ring that pulses on the kick. The word covers two things: the live effect a player shows while a song plays, and a video file made from a song so it can be posted where audio alone cannot, such as YouTube, TikTok and Reels.
What is the difference between a visualizer and a music video?+
A music video is filmed or animated to the song by people making choices shot by shot. A visualizer is generated from the audio by software: the motion comes from the measured sound, usually over the cover art or a designed scene. Labels release official visualizers next to, or instead of, a full music video because one costs a day and the other costs a shoot.
How does a music visualizer know where the beat is?+
It measures it. The audio is cut into short slices, each slice is split into frequencies with a Fourier transform, and the software watches for sudden jumps in energy, called onsets. Jumps in the low end are the kick drum. Spacing the onsets out gives the tempo. None of this understands the music; it reacts to loudness changes, which is why a good visualizer listens to a few specific events rather than every wiggle.
What is music visualization?+
The broader practice of turning music into images: real-time effects in players and at concerts, rendered visualizer videos, scientific plots such as spectrograms, and art made from a recording. A music visualizer is the most common form of it, software that draws a picture from audio as it plays or frame by frame.
Do I need a visualizer to post a song on YouTube?+
No. YouTube accepts any video, and one still image over the whole track is the cheapest valid upload. A visualizer helps when the video itself has to hold attention: on Shorts, TikTok and Reels a still frame reads as an ad, and on YouTube a moving picture gives the thumbnail and the first seconds something to show.
Do visualizers on Canva and in templates react to the music?+
Often not. Many template tools animate soundwave stickers on a timer, so the bars move the same way under any song. A real visualizer analyzes the file. The test: scrub to a silent stretch or a hard stop in the song and watch whether the picture goes quiet with it.
Sources, read October 19, 2026
Related
- Music visualizerThe tool: nineteen styles, 1080p, free.
- Audio visualizerThe classic: frequency bars and a halo around the cover.
- Oscilloscope visualizerLeft channel against right, the sound as a figure.
- Best music visualizersSixteen tools compared on watermark, length and resolution.
- What a sound waveform isThe other picture of the same numbers.
- BPM and key finderThe tempo a visualizer locks to, read from your file.