Guides · Waveforms
How to draw a waveform: by hand, on a graph, and from a real recording
How to draw a sine, square or AC waveform by hand and label it, plot one free online, draw voltage against current and clippers, or make one from an audio file.
November 4, 2026
In short
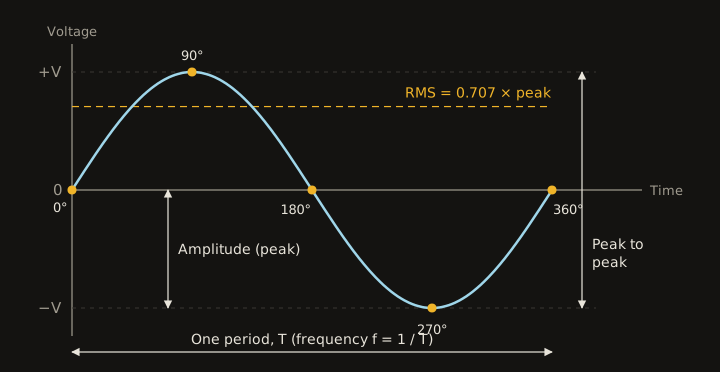
- To draw a sine wave by hand, divide one period into four and mark five points: zero, positive peak, zero, negative peak, zero. Then join them with a curve that is round at the peaks.
- To label an AC wave, mark the amplitude, the peak to peak value, the period T and the RMS value, which is 0.707 times the peak. Frequency is 1 / T.
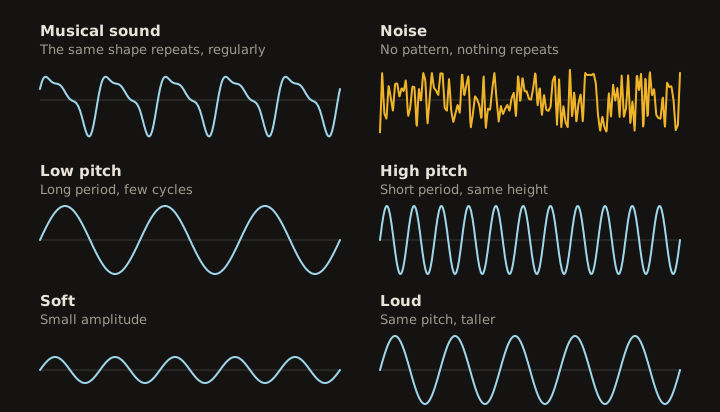
- A musical sound repeats regularly and noise does not. A shorter period means a higher pitch, and a taller wave means a louder sound.
- For a free plot, use Desmos with a formula. For a digital timing diagram, use WaveDrom. For the shape of a real recording, make it from the file.
“Draw a waveform” means different things to different people. A physics student needs a labelled sine wave for an exam. An electronics student needs voltage against current, or the output of a clipper. A designer wants a clean curve for a logo. Someone with a recording wants the shape of that exact sound. They need different drawings, so this guide takes them in turn, starting with the one you can do with a pencil.
If you are after what a waveform actually shows, our guide to what a sound waveform is covers that. This one is about getting it onto the page.
Draw a sine wave by hand
Almost everything else starts here, and five points get you the whole curve.
- Draw a horizontal line for time and a vertical line through its left end. The horizontal line is the zero level, so leave equal room above and below it.
- Choose the length of one full cycle, the period, and divide it into four equal parts. Squared paper makes this easy: use 4, 8 or 12 squares.
- Choose a height for the peak and mark the same distance above and below the line.
- Mark five points: zero at the start, the top at one quarter, zero at the half, the bottom at three quarters, and zero at the end.
- Join them with one smooth curve.
The usual mistake is a pointed peak, which turns the sine into a triangle. A sine wave is flat at its peaks and steepest where it crosses the zero line, so slow the pencil down at the top and bottom. For one extra guide, the curve is at about 0.7 of the peak height halfway between zero and the peak, which is the 45 degree point.
Label it
A drawing with no labels loses marks. These are the ones to include:
- Axes. Voltage, or displacement for a sound wave, on the vertical axis. Time on the horizontal.
- Amplitude. From the zero line to one peak, and not from top to bottom.
- Peak to peak. From top to bottom, twice the amplitude.
- Period, T. The time for one complete cycle. Measure it between two matching points, such as peak to peak or one upward zero crossing to the next.
- Frequency. Not drawn, but f = 1 / T. A period of 20 ms gives 50 Hz.
- RMS. For a sine wave, the peak times 0.707, drawn as a dashed line. It is the number a mains supply is quoted by.
Mains power makes a good worked example, and it is often the one asked for. A 230 V, 50 Hz supply has a peak of about 325 V and a period of 20 ms. A 120 V, 60 Hz supply has a peak of about 170 V and a period of about 16.7 ms.
The other basic shapes
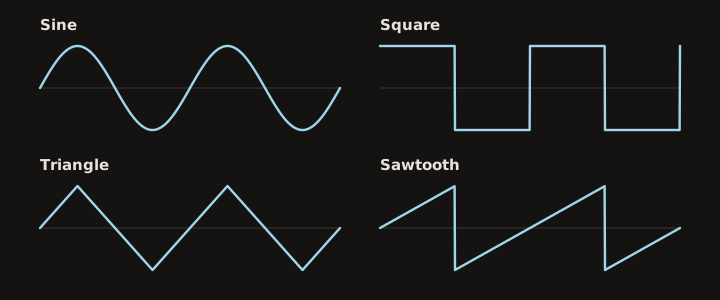
Square, triangle and sawtooth waves have the same axes and the same period. Only the path between the peaks changes. Draw the square wave’s jumps as straight vertical lines, with the top and bottom flat. Draw the triangle with straight sides that meet in sharp points. The sawtooth climbs in a straight line, then drops straight down, once per period.
The waveform of a musical sound
This is a common textbook question, and what it tests is the idea of regularity. A musical note is periodic, so draw a shape that repeats at even intervals. It does not need to be a pure sine wave; a real instrument gives a more complicated shape, but that shape keeps coming back. Noise is the opposite: an irregular line with no repeating pattern.
The same kind of drawing shows the other two properties. For a higher pitch, keep the height and squeeze the cycles closer together. For a louder sound, keep the spacing and make the wave taller. The shape itself is what makes a violin and a flute sound different on the same note. You can hear the difference between the basic shapes with a tone generator.
Voltage and current
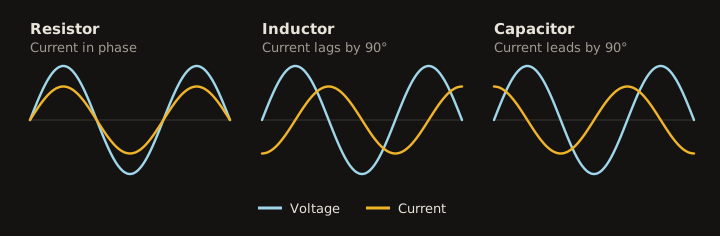
To show voltage and current together, draw both on one time axis. Make the current smaller or a different color so the two can be told apart, since their heights are in different units anyway. What matters is where the peaks fall.
- Resistor. The two are in phase and peak at the same moment.
- Inductor. The current lags, and peaks a quarter cycle (90 degrees) after the voltage.
- Capacitor. The current leads, and peaks a quarter cycle before the voltage.
The old mnemonic is “ELI the ICE man”: in an inductor (L), voltage (E) comes before current (I), and in a capacitor (C), current comes before voltage. A phasor diagram shows the same thing with arrows: the voltage and current are two arrows with the phase difference as the angle between them, and the height of a waveform at any moment is the height of its rotating arrow.
Clipper circuits
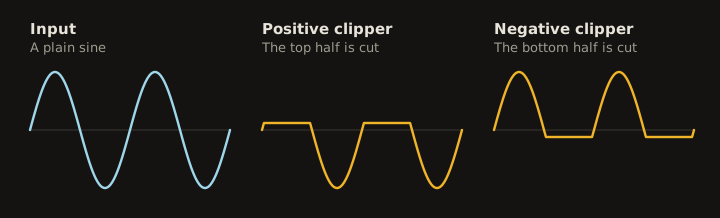
A clipper cuts off part of a wave, so draw the input first and the output directly under it, with the same time scale. A positive clipper removes the top half and a negative clipper removes the bottom half. With an ideal diode, the cut part lies flat on zero. With a real silicon diode wired in parallel with the output, it sits at about 0.7 V, which is why many textbooks draw it slightly off the axis, as here.
Plot one for free in software
When a neat curve matters more than the practice, let software compute it.
Desmos is a free graphing calculator that runs in a browser with no account. Type a formula and the curve appears; change the number in front to change the height, and the number inside to change the frequency.
| Shape | Type this in Desmos |
|---|---|
| Sine | y = sin(x) |
| Square | y = sign(sin(x)) |
| Triangle | y = 2/pi * arcsin(sin(x)) |
| Sawtooth | y = 2(x/(2pi) - floor(x/(2pi) + 1/2)) |
Excel or Google Sheets works too. Put angles from 0 to 360 in steps of 15 in column A, put =SIN(RADIANS(A2)) in column B and fill it down, then insert a scatter chart with smooth lines. A square wave is =SIGN(SIN(RADIANS(A2))).
Inkscape, the free vector editor, has a Function Plotter under Extensions, then Render. Draw and select a rectangle first, since the plot fits inside it. The result is an editable vector curve, which suits a logo or a print better than a screenshot of a graph.
WaveDrom is the right tool for digital signals. It draws timing diagrams from a short text description, where P is a clock, 0 and 1 are levels and a dot holds the last value:
{ signal: [
  { name: "clk",  wave: "P......" },
  { name: "data", wave: "0.1..0." }
]}
Make one from a real recording
Nobody draws the waveform of a song by hand, because it contains millions of samples. The file already holds the shape, so it just needs drawing out.
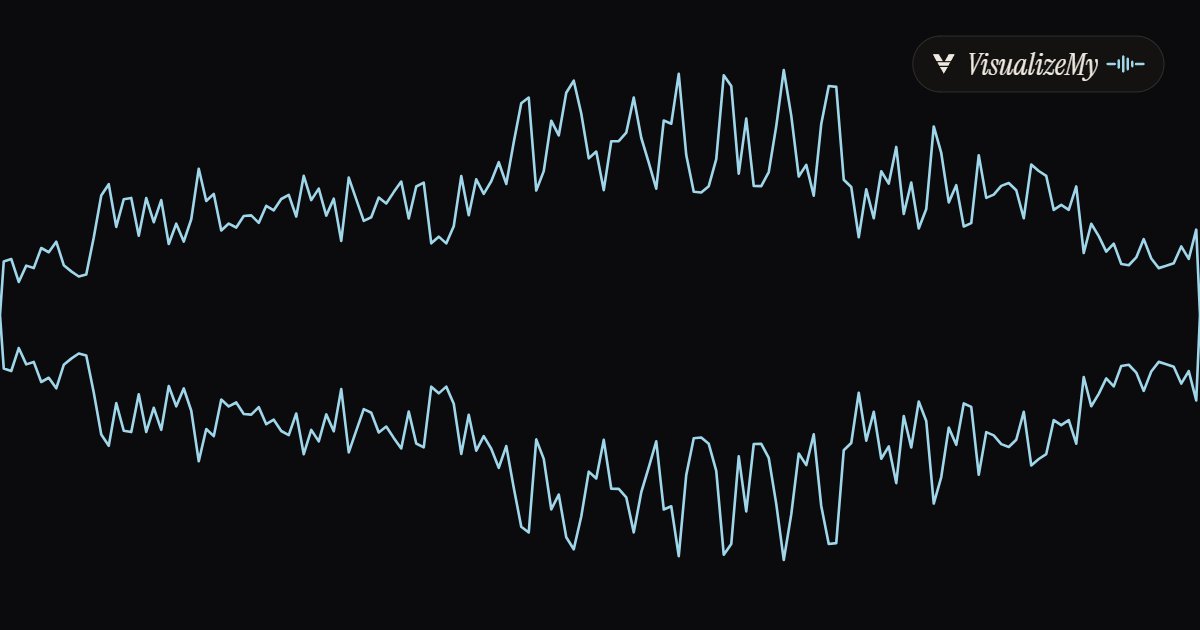
Our waveform image generator does that in the browser: drop the file, choose bars, fill or line, and download a PNG, or an SVG to scale, cut or recolor elsewhere. Nothing uploads. That shape is the real audio, slice by slice, which is what you want for sound wave art of a voice message or a song.
If you prefer the command line, FFmpeg draws one from a file. We tested this on an MP3:
ffmpeg -i song.mp3 -filter_complex "aformat=channel_layouts=mono,showwavespic=s=1920x600:colors=white" -frames:v 1 wave.png
To make the waveform move with the sound, as a video, use the waveform video maker.
Draw directly on the audio
In an audio editor, drawing on a waveform means changing the sound itself. Audacity’s Draw tool and Pro Tools’ Pencil tool both let you do this, but only when you have zoomed in far enough to see the individual samples. Both exist for repairs. A click shows up as a sharp spike a few samples wide, and you can redraw it into the line on either side. In Pro Tools the edit changes the audio file itself, so keep a copy first.
These tools are not a way to compose by drawing. At 44,100 samples a second, a tenth of a second of sound is 4,410 points, which is why you only ever do this to a tiny stretch.
Questions
How do you draw a sine wave by hand?+
Draw a horizontal time axis and a vertical axis, and divide one period on the time axis into four equal parts. Mark five points: zero at the start, the positive peak at one quarter, zero at the half, the negative peak at three quarters, and zero at the end. Join them with a smooth curve that is rounded at the peaks and steepest where it crosses the axis.
How do you draw and label an AC waveform?+
Draw one sine cycle with voltage on the vertical axis and time on the horizontal. Label the peak value, the peak to peak value, the period T and the RMS value, which is 0.707 times the peak. For 230 V, 50 Hz mains, the peak is about 325 V and the period is 20 ms. For 120 V, 60 Hz mains, the peak is about 170 V and the period is about 16.7 ms.
How do you draw the waveform of a musical sound?+
Draw a shape that repeats at regular intervals, since a musical note is periodic. It does not have to be a perfect sine: a real instrument gives a more complicated shape, but the same shape keeps repeating. Noise is the opposite, an irregular line in which nothing repeats.
What is the output waveform of a negative clipper?+
The positive half cycles pass through and the negative half cycles are cut off. With an ideal diode, the cut half lies flat on zero. With a real silicon diode wired in parallel with the output, it sits at about 0.7 V, so textbooks often draw the flat part slightly off the axis.
How do you draw voltage and current waveforms?+
Use the same time axis for both, with the current drawn smaller or in a second color. In a resistor, the two peak together. In an inductor, the current peaks a quarter cycle after the voltage. In a capacitor, it peaks a quarter cycle before.
Can I draw a waveform online for free?+
Yes. Desmos plots any waveform from a formula, such as y = sin(x), and needs no account. WaveDrom draws digital timing diagrams from a short text description. To get the waveform of an actual recording, a waveform image generator makes it from the file.
How do you draw on a waveform in Audacity or Pro Tools?+
Zoom in until you can see the individual samples, then use the Draw tool in Audacity or the Pencil tool in Pro Tools to move them. Neither tool works when zoomed out. It is meant for repairing a click or a pop a few samples long, not for writing a sound by hand.
Sources, read November 4, 2026
Related
- Waveform image generatorAny audio file as a still sound wave, PNG or SVG, free.
- What a sound waveform isWhat the shape means, and how to read loud, quiet and clipped.
- Waveform video makerA waveform that moves with the voice, as a 1080p MP4.
- Oscilloscope visualizerLeft channel against right, the signal as a moving figure.
- Tone generatorHear a sine, square, triangle and sawtooth at any pitch.